> ## Documentation Index
> Fetch the complete documentation index at: https://docs.mainwp.com/llms.txt
> Use this file to discover all available pages before exploring further.
# Uptime Monitoring
> Configure MainWP Dashboard Monitoring Settings for child sites, including built-in Uptime Monitoring, Site Health Monitoring, retention, status codes, and email notifications.
MainWP Dashboard Monitoring Settings include built-in Uptime Monitoring and Site Health Monitoring for connected child sites.
This page documents built-in Monitoring Settings in MainWP Dashboard. It is different from the [Advanced Uptime Monitor Add-on](/add-ons/monitoring/advanced-uptime-monitor-extension).
## What You'll Learn
* Access the Monitoring Settings page
* Configure Site Health Monitoring options
* Configure global uptime monitoring options
* Set data retention for monitoring history
* Review status code details in monitoring views
* Configure uptime email notifications, including recovery alerts
* Use the `[uptime.status]` token in uptime monitoring emails
* Override settings per site and add sub-monitors
## Prerequisites
* MainWP Dashboard plugin installed and activated
* MainWP Child plugin connected on the sites you want to monitor
* WP Cron or server cron configured for scheduled checks
* Access to MainWP Dashboard settings and email settings
***
## Access Monitoring Settings
Go to **MainWP > Settings > Monitoring Settings**.
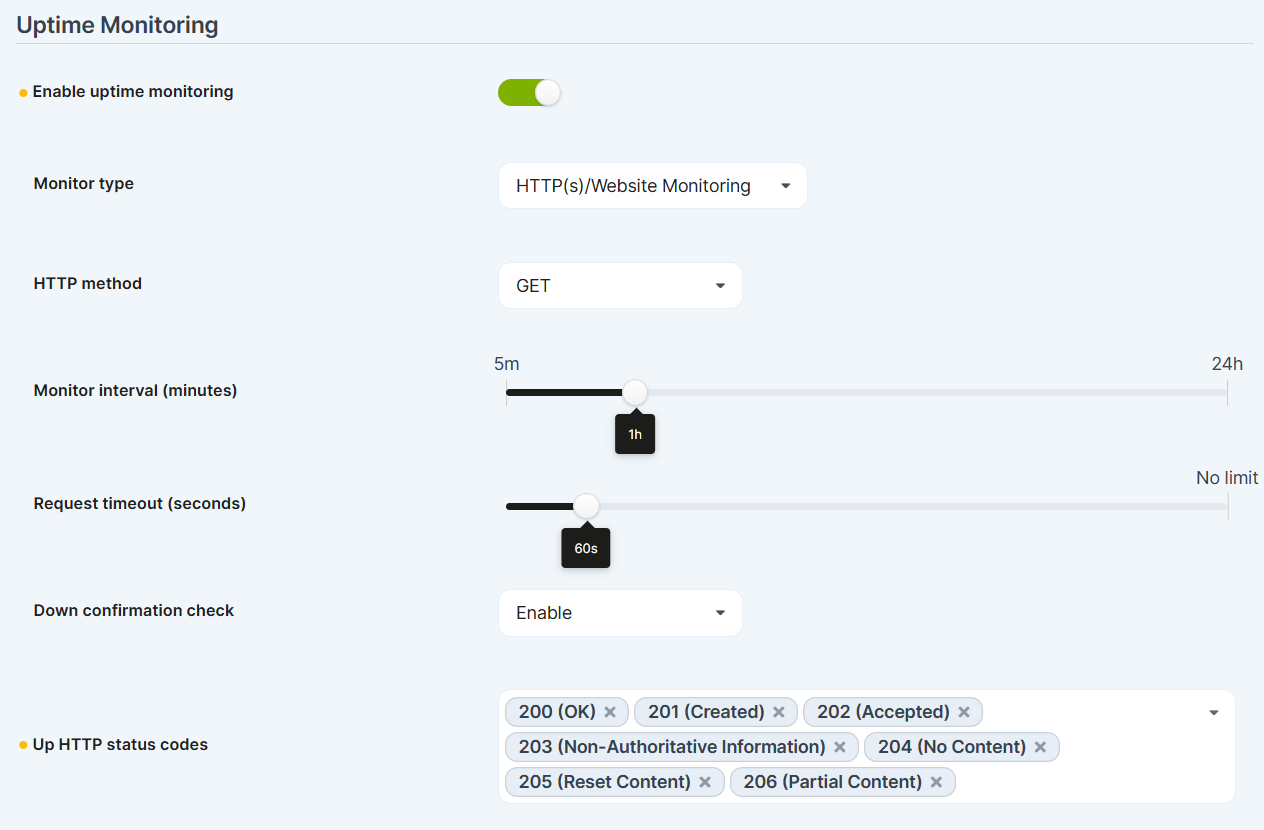
In the **Uptime Monitoring** section, configure global monitor behavior for all child sites.
In the **Site Health Monitoring** section, configure health monitoring behavior.
 ***
## Monitoring Settings Reference
### HTTP Response Check Settings
These settings appear in the same Monitoring Settings page and share status-code logic with Uptime Monitoring.
| Setting | Default | Description |
| ----------------------------------------------------- | ----------------------------- | ------------------------------------------------------- |
| Check site HTTP response after update | Disabled | Checks site header response after update actions |
| Check site HTTP response method | Head | Method for post-update check: `Head (default)` or `Get` |
| Up HTTP Codes for HTTP Response and Uptime Monitoring | `200,201,202,203,204,205,206` | Status codes treated as UP for both features |
### Uptime Monitoring Settings
| Setting | Default | Description |
| -------------------------- | -------- | ------------------------------------------------------------------------------------------------------------- |
| Enable Uptime Monitoring | Disabled | Enables or disables built-in uptime monitoring globally |
| Monitor Type | HTTP(s) | `HTTP(s)`, `Ping`, or `Keyword Monitoring` |
| Method | HEAD | For HTTP(s) monitor type: `HEAD`, `GET`, `POST`, `PUSH`, `PATCH`, or `DELETE` |
| Keyword to Look For | Empty | Appears when Monitor Type is `Keyword Monitoring` |
| Monitor Interval (minutes) | 60m | Slider from `5m`, `10m`, `15m`, `30m`, `45m`, then `1h` through `24h` |
| Timeout (seconds) | 60s | Slider values: `30s`, `45s`, `60s`, `90s`, `2-10min`, `15min`, `30min`, `45min`, `60min`, `90min`, `No limit` |
| Down Confirmation Check | Enabled | Confirms downtime before creating alerts |
| Monitoring Data Retention | 180 days | Keeps history for selected duration before automatic cleanup |
Monitoring Data Retention options:
* Keep forever (no automatic cleanup)
* 30 days
* 90 days (3 months)
* 180 days (6 months)
* 365 days (1 year)
Configure **Maximum simultaneous uptime monitoring requests** in **MainWP > Settings > Advanced Settings**.
### Site Health Monitoring Settings
| Setting | Default | Description |
| ----------------------------- | ------------------ | ------------------------------------------------- |
| Enable Site Health monitoring | Disabled | Enables monitoring using WordPress Site Health |
| Site health threshold | Should be improved | Threshold options: `Should be improved` or `Good` |
WordPress Site Health is a WordPress core feature that evaluates the site's configuration and reports whether the site is in good condition or needs attention. It combines checks for areas such as performance, security, and recommended configuration, then presents the results in the built-in Site Health screen.
On each child site, you can review the same information directly in the site `wp-admin` under **Tools > Site Health**. The child site's Site Health screen includes the native WordPress **Status** and **Info** tabs.
Site Health Monitoring in this page uses that existing WordPress core Site Health data and does not rely on third-party services. MainWP simply retrieves the Site Health result already generated on the child site, compares it against your configured threshold, and relays the status in your MainWP Dashboard and notifications.
Site Health Monitoring notification templates support the `[site.name]` token for dynamic site name insertion.
Use `[site.name]` in the email subject, heading, or template content to insert the child site name automatically.
***
## Monitoring Views and Status Codes
### Monitoring Table
Go to **MainWP > Sites > Monitoring** to review monitor status across sites.
The Monitoring table includes a **Status code** column so you can quickly see the latest HTTP response code for each monitor.
### Individual Site Uptime Widget
On the individual site Operations page, the Uptime Monitoring widget shows:
* Current status (UP, DOWN, PENDING, or DISABLED)
* Current HTTP status code
* Incidents and uptime ratio
* Response time history
Use **Check Now** from the Monitoring page actions for immediate checks on selected sites.
### Site Health in Monitoring Views
The Monitoring page also includes Site Health indicators so you can review health state alongside uptime data.
These indicators reflect the same WordPress core Site Health status shown on the child site in **Tools > Site Health**, allowing you to monitor that native WordPress information centrally from MainWP Dashboard.
***
## Uptime Monitoring Email Notifications
Go to **MainWP > Settings > Email Settings > Uptime Monitoring Email**.
***
## Monitoring Settings Reference
### HTTP Response Check Settings
These settings appear in the same Monitoring Settings page and share status-code logic with Uptime Monitoring.
| Setting | Default | Description |
| ----------------------------------------------------- | ----------------------------- | ------------------------------------------------------- |
| Check site HTTP response after update | Disabled | Checks site header response after update actions |
| Check site HTTP response method | Head | Method for post-update check: `Head (default)` or `Get` |
| Up HTTP Codes for HTTP Response and Uptime Monitoring | `200,201,202,203,204,205,206` | Status codes treated as UP for both features |
### Uptime Monitoring Settings
| Setting | Default | Description |
| -------------------------- | -------- | ------------------------------------------------------------------------------------------------------------- |
| Enable Uptime Monitoring | Disabled | Enables or disables built-in uptime monitoring globally |
| Monitor Type | HTTP(s) | `HTTP(s)`, `Ping`, or `Keyword Monitoring` |
| Method | HEAD | For HTTP(s) monitor type: `HEAD`, `GET`, `POST`, `PUSH`, `PATCH`, or `DELETE` |
| Keyword to Look For | Empty | Appears when Monitor Type is `Keyword Monitoring` |
| Monitor Interval (minutes) | 60m | Slider from `5m`, `10m`, `15m`, `30m`, `45m`, then `1h` through `24h` |
| Timeout (seconds) | 60s | Slider values: `30s`, `45s`, `60s`, `90s`, `2-10min`, `15min`, `30min`, `45min`, `60min`, `90min`, `No limit` |
| Down Confirmation Check | Enabled | Confirms downtime before creating alerts |
| Monitoring Data Retention | 180 days | Keeps history for selected duration before automatic cleanup |
Monitoring Data Retention options:
* Keep forever (no automatic cleanup)
* 30 days
* 90 days (3 months)
* 180 days (6 months)
* 365 days (1 year)
Configure **Maximum simultaneous uptime monitoring requests** in **MainWP > Settings > Advanced Settings**.
### Site Health Monitoring Settings
| Setting | Default | Description |
| ----------------------------- | ------------------ | ------------------------------------------------- |
| Enable Site Health monitoring | Disabled | Enables monitoring using WordPress Site Health |
| Site health threshold | Should be improved | Threshold options: `Should be improved` or `Good` |
WordPress Site Health is a WordPress core feature that evaluates the site's configuration and reports whether the site is in good condition or needs attention. It combines checks for areas such as performance, security, and recommended configuration, then presents the results in the built-in Site Health screen.
On each child site, you can review the same information directly in the site `wp-admin` under **Tools > Site Health**. The child site's Site Health screen includes the native WordPress **Status** and **Info** tabs.
Site Health Monitoring in this page uses that existing WordPress core Site Health data and does not rely on third-party services. MainWP simply retrieves the Site Health result already generated on the child site, compares it against your configured threshold, and relays the status in your MainWP Dashboard and notifications.
Site Health Monitoring notification templates support the `[site.name]` token for dynamic site name insertion.
Use `[site.name]` in the email subject, heading, or template content to insert the child site name automatically.
***
## Monitoring Views and Status Codes
### Monitoring Table
Go to **MainWP > Sites > Monitoring** to review monitor status across sites.
The Monitoring table includes a **Status code** column so you can quickly see the latest HTTP response code for each monitor.
### Individual Site Uptime Widget
On the individual site Operations page, the Uptime Monitoring widget shows:
* Current status (UP, DOWN, PENDING, or DISABLED)
* Current HTTP status code
* Incidents and uptime ratio
* Response time history
Use **Check Now** from the Monitoring page actions for immediate checks on selected sites.
### Site Health in Monitoring Views
The Monitoring page also includes Site Health indicators so you can review health state alongside uptime data.
These indicators reflect the same WordPress core Site Health status shown on the child site in **Tools > Site Health**, allowing you to monitor that native WordPress information centrally from MainWP Dashboard.
***
## Uptime Monitoring Email Notifications
Go to **MainWP > Settings > Email Settings > Uptime Monitoring Email**.
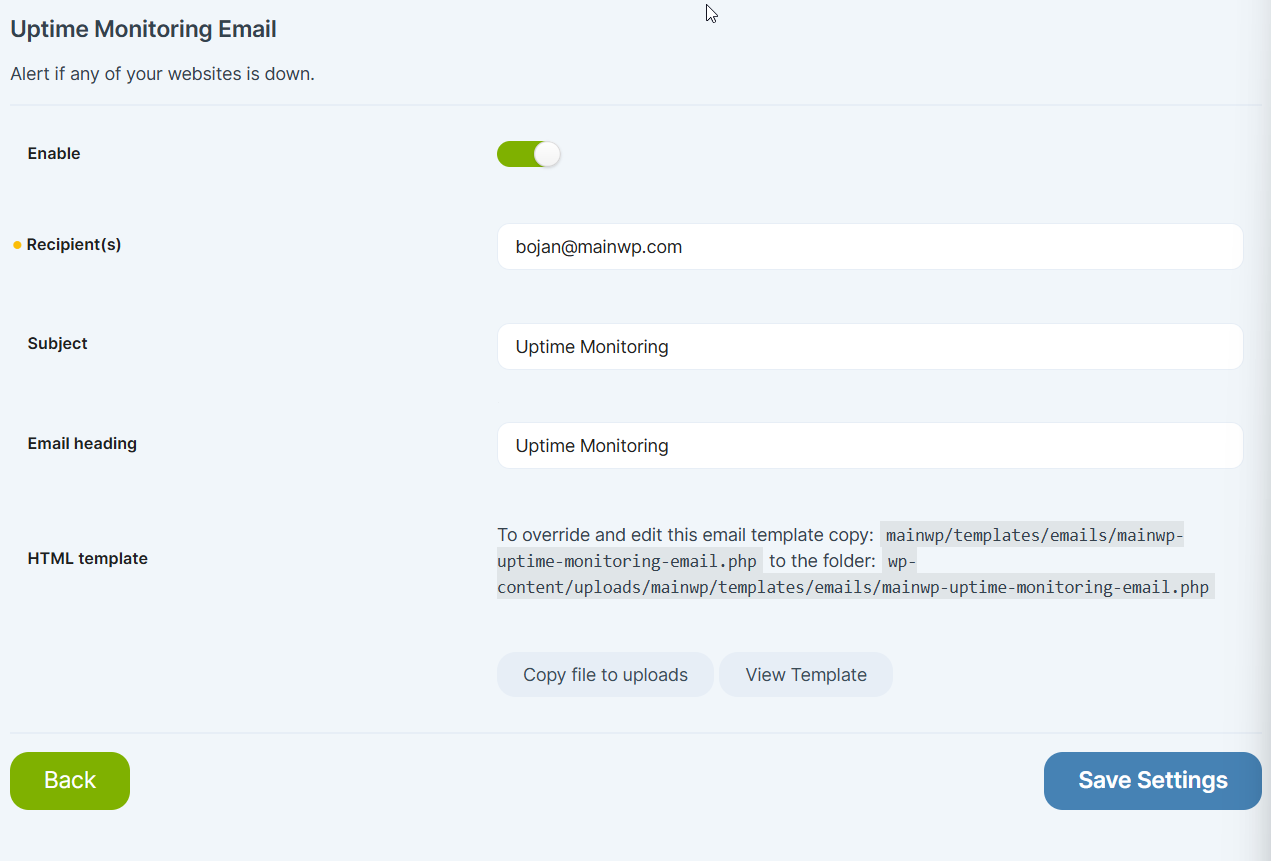 | Setting | Description |
| ------------------- | ------------------------------------------------------------------------------------- |
| Enable | Turns uptime email notifications on or off |
| Recipient(s) | One or more email addresses for alerts |
| Subject and Heading | Customizes the notification subject and heading |
| HTML Template | Uses default template or custom copy in `wp-content/uploads/mainwp/templates/emails/` |
Uptime notifications are sent on important status changes, including when a site goes down and when it comes back online. Emails include the monitor URL, status code, and event timestamp.
### `[uptime.status]` Token Support
You can use `[uptime.status]` in uptime email content and settings to insert the current status value.
Supported values include:
* `UP`
* `DOWN`
* `PENDING`
* `DISABLED`
***
## Per-Site Uptime Settings
You can override global settings for specific sites.
| Setting | Description |
| ------------------- | ------------------------------------------------------------------------------------- |
| Enable | Turns uptime email notifications on or off |
| Recipient(s) | One or more email addresses for alerts |
| Subject and Heading | Customizes the notification subject and heading |
| HTML Template | Uses default template or custom copy in `wp-content/uploads/mainwp/templates/emails/` |
Uptime notifications are sent on important status changes, including when a site goes down and when it comes back online. Emails include the monitor URL, status code, and event timestamp.
### `[uptime.status]` Token Support
You can use `[uptime.status]` in uptime email content and settings to insert the current status value.
Supported values include:
* `UP`
* `DOWN`
* `PENDING`
* `DISABLED`
***
## Per-Site Uptime Settings
You can override global settings for specific sites.
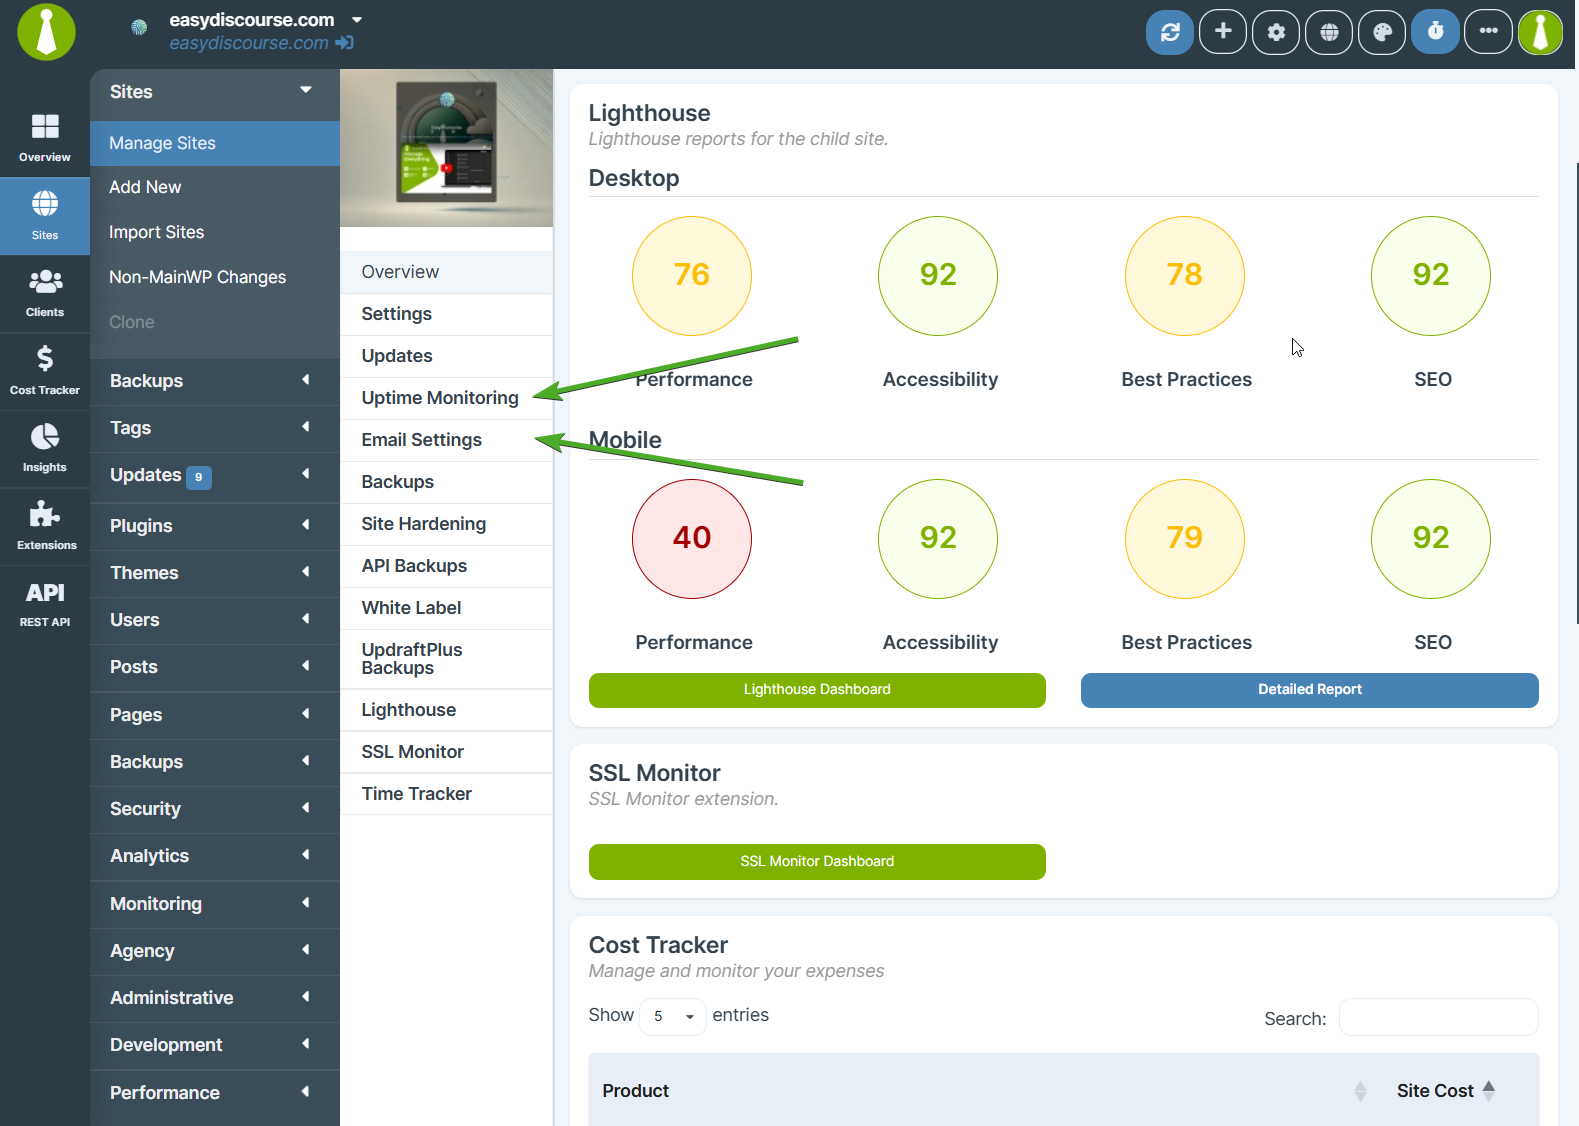 Access per-site settings at **Child Site Dashboard > Uptime Monitoring**.
Per-site options support `Use global setting` for applicable fields.
| Option | Description |
| ----------------------------------------------------- | --------------------------------------------------------------------------------------- |
| Enable Uptime Monitoring | `Use global setting`, `Enable`, or `Disable` |
| Monitor Type | `Use global setting`, `HTTP(s)`, `Ping`, or `Keyword Monitoring` |
| Method | `Use global setting` or HTTP methods (`HEAD`, `GET`, `POST`, `PUSH`, `PATCH`, `DELETE`) |
| Keyword to Look For | Site-specific keyword for keyword monitoring |
| Monitor Interval (minutes) | Site-specific interval slider or global value |
| Timeout (seconds) | Site-specific timeout slider or global value |
| Down Confirmation Check | `Use global setting`, `Enable`, or `Disable` |
| Up HTTP Codes for HTTP Response and Uptime Monitoring | Site-specific code list or global value |
| Sub-Monitors | Add extra monitored paths with **Create Sub-Monitor** |
| Monitor actions | Disable the monitor or delete a sub-monitor |
When adding a sub-monitor, enter only the path segment (excluding the main site URL).
***
## Related Resources
* [Manage Sites](/sites/management/manage-child-sites) - Manage child site connections and operations
* [MainWP Dashboard Settings](/sites/management/mainwp-dashboard-settings) - Reference for all Dashboard settings
* [Disable WP Cron](/customization/disable-wp-cron) - Configure server cron for reliable schedules
* [Advanced Uptime Monitor Add-on](/add-ons/monitoring/advanced-uptime-monitor-extension) - Third-party API-based uptime monitoring
Access per-site settings at **Child Site Dashboard > Uptime Monitoring**.
Per-site options support `Use global setting` for applicable fields.
| Option | Description |
| ----------------------------------------------------- | --------------------------------------------------------------------------------------- |
| Enable Uptime Monitoring | `Use global setting`, `Enable`, or `Disable` |
| Monitor Type | `Use global setting`, `HTTP(s)`, `Ping`, or `Keyword Monitoring` |
| Method | `Use global setting` or HTTP methods (`HEAD`, `GET`, `POST`, `PUSH`, `PATCH`, `DELETE`) |
| Keyword to Look For | Site-specific keyword for keyword monitoring |
| Monitor Interval (minutes) | Site-specific interval slider or global value |
| Timeout (seconds) | Site-specific timeout slider or global value |
| Down Confirmation Check | `Use global setting`, `Enable`, or `Disable` |
| Up HTTP Codes for HTTP Response and Uptime Monitoring | Site-specific code list or global value |
| Sub-Monitors | Add extra monitored paths with **Create Sub-Monitor** |
| Monitor actions | Disable the monitor or delete a sub-monitor |
When adding a sub-monitor, enter only the path segment (excluding the main site URL).
***
## Related Resources
* [Manage Sites](/sites/management/manage-child-sites) - Manage child site connections and operations
* [MainWP Dashboard Settings](/sites/management/mainwp-dashboard-settings) - Reference for all Dashboard settings
* [Disable WP Cron](/customization/disable-wp-cron) - Configure server cron for reliable schedules
* [Advanced Uptime Monitor Add-on](/add-ons/monitoring/advanced-uptime-monitor-extension) - Third-party API-based uptime monitoring