> ## Documentation Index
> Fetch the complete documentation index at: https://docs.mainwp.com/llms.txt
> Use this file to discover all available pages before exploring further.
# Overview of MainWP Dashboard icons
> Learn about the most common icons on the MainWP Dashboard including sync and bulk action status indicators, the Dashboard site update notice, Manage Sites connection status, and Monitoring page indicators.
This article covers the most common icons you may encounter on the MainWP Dashboard.
## Sync and Check Now bulk actions
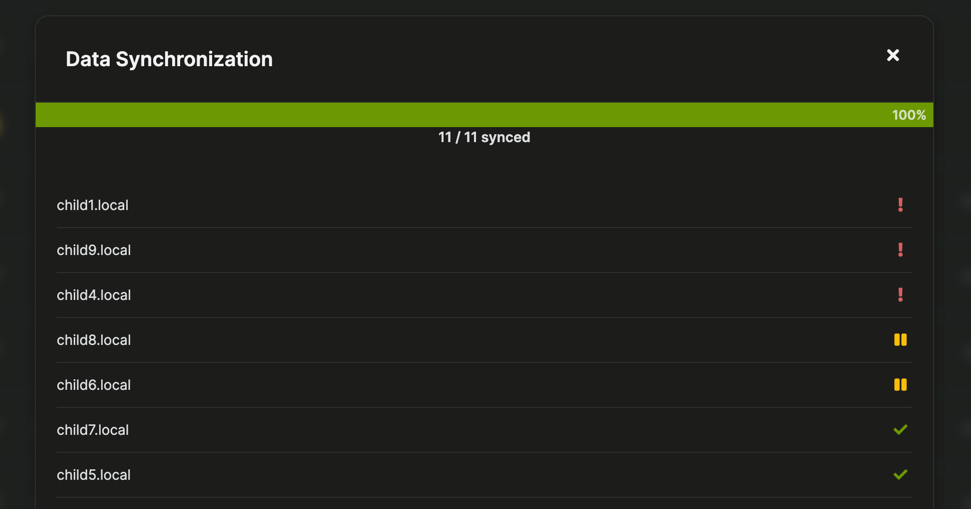 During bulk **Sync Data** and **Check Now** actions, a popup modal is displayed, and status icons are shown next to each site. You can hover your mouse cursor over these icons to reveal more information.
* **Red exclamation mark** indicates that the process failed. For example, it could be due to the fact that the MainWP Child plugin was not reachable on the Child Site.
* **Yellow exclamation mark** indicates that the process timed out. The tooltip shows **Process timed out. Please try again.**
* **Yellow pause icon** indicates that the site is suspended. Learn more in [Suspend or Unsuspend a Child Site](/sites/management/manage-child-sites#suspend-or-unsuspend-a-child-site).
* **Green check mark** indicates that the process was completed successfully.
## Header Sync button
The top header **Sync** button can show a small red pulsating badge.
This badge appears when the most recent sync timestamp exists and is older than 24 hours.
* In global context, MainWP checks overall MainWP Dashboard sync status.
* In single-site context, MainWP checks the current site sync timestamp.
When no red badge is shown:
* If sync data is recent, the tooltip shows **Last sync: ...** with sync guidance.
* If no sync timestamp exists yet, the tooltip shows sync guidance such as **Click here to sync all sites.**
* In single-site context with no sync timestamp yet, the tooltip can show **Get fresh data from example.com.**
Click **Sync** to refresh Child Site data immediately.
## Available updates on the Dashboard site
During bulk **Sync Data** and **Check Now** actions, a popup modal is displayed, and status icons are shown next to each site. You can hover your mouse cursor over these icons to reveal more information.
* **Red exclamation mark** indicates that the process failed. For example, it could be due to the fact that the MainWP Child plugin was not reachable on the Child Site.
* **Yellow exclamation mark** indicates that the process timed out. The tooltip shows **Process timed out. Please try again.**
* **Yellow pause icon** indicates that the site is suspended. Learn more in [Suspend or Unsuspend a Child Site](/sites/management/manage-child-sites#suspend-or-unsuspend-a-child-site).
* **Green check mark** indicates that the process was completed successfully.
## Header Sync button
The top header **Sync** button can show a small red pulsating badge.
This badge appears when the most recent sync timestamp exists and is older than 24 hours.
* In global context, MainWP checks overall MainWP Dashboard sync status.
* In single-site context, MainWP checks the current site sync timestamp.
When no red badge is shown:
* If sync data is recent, the tooltip shows **Last sync: ...** with sync guidance.
* If no sync timestamp exists yet, the tooltip shows sync guidance such as **Click here to sync all sites.**
* In single-site context with no sync timestamp yet, the tooltip can show **Get fresh data from example.com.**
Click **Sync** to refresh Child Site data immediately.
## Available updates on the Dashboard site
 You may occasionally see the red **Update Dashboard Site** label in the bottom-left area of your MainWP Dashboard navigation. This label appears when the WordPress installation where the MainWP Dashboard plugin is installed reports an available plugin, theme, WordPress core, or translation update. That includes updates to the MainWP Dashboard plugin itself. Click that label when it appears and perform all available updates on your Dashboard site.
MainWP shows this label from the Dashboard site's own WordPress update data. WordPress builds that update count from update transients for plugins, themes, WordPress core, and translations. The label is not based on available updates for connected MainWP Child sites.
If the Dashboard site appears fully updated but the label still appears, WordPress may still be returning stale update data from the database or from a persistent object cache. Open the Dashboard site's WordPress Updates screen, click **Check again.**, and clear any server-side or object cache used by the Dashboard site. If the label remains after a fresh update check and cache purge, review the Dashboard site's update transients or any plugins that filter WordPress update data.
## Manage Sites table
You may occasionally see the red **Update Dashboard Site** label in the bottom-left area of your MainWP Dashboard navigation. This label appears when the WordPress installation where the MainWP Dashboard plugin is installed reports an available plugin, theme, WordPress core, or translation update. That includes updates to the MainWP Dashboard plugin itself. Click that label when it appears and perform all available updates on your Dashboard site.
MainWP shows this label from the Dashboard site's own WordPress update data. WordPress builds that update count from update transients for plugins, themes, WordPress core, and translations. The label is not based on available updates for connected MainWP Child sites.
If the Dashboard site appears fully updated but the label still appears, WordPress may still be returning stale update data from the database or from a persistent object cache. Open the Dashboard site's WordPress Updates screen, click **Check again.**, and clear any server-side or object cache used by the Dashboard site. If the label remains after a fresh update check and cache purge, review the Dashboard site's update transients or any plugins that filter WordPress update data.
## Manage Sites table
 Different icons will be displayed next to child sites to indicate their status.
* **Red icon** indicates that the site is disconnected, and you may click the icon to try to reconnect it.
* **Yellow pause** icon indicates that the site is suspended. Learn more in [Suspend or Unsuspend a Child Site](/sites/management/manage-child-sites#suspend-or-unsuspend-a-child-site).
* **Green icon** indicates that the site is properly connected. Clicking the icon will initialize a Synchronization with that site.
## Monitoring Page table
Different icons will be displayed next to child sites to indicate their status.
* **Red icon** indicates that the site is disconnected, and you may click the icon to try to reconnect it.
* **Yellow pause** icon indicates that the site is suspended. Learn more in [Suspend or Unsuspend a Child Site](/sites/management/manage-child-sites#suspend-or-unsuspend-a-child-site).
* **Green icon** indicates that the site is properly connected. Clicking the icon will initialize a Synchronization with that site.
## Monitoring Page table
 On the Monitoring page, multiple table indicators are used:
* In the **Status** column, a **green up icon** means the monitor is currently online.
* In the **Status** column, a **red down icon** means the monitor is currently offline.
* In the **Status** column, a **gray circle icon** means status is pending (not enough check data yet).
* In the **Status** column, a **gray stop icon** means the monitor is disabled.
* The **Site Health** column shows **Good** (green) or **Should be improved** (orange) when Site Health monitoring is enabled.
* **Last 24h Status** shows hourly green/red/gray indicators and a summary such as **Up** percentage or **Pending**.
More information about Site Health and monitoring settings is available [in this document](/sites/management/manage-child-sites#site-health-monitoring).
On the Monitoring page, multiple table indicators are used:
* In the **Status** column, a **green up icon** means the monitor is currently online.
* In the **Status** column, a **red down icon** means the monitor is currently offline.
* In the **Status** column, a **gray circle icon** means status is pending (not enough check data yet).
* In the **Status** column, a **gray stop icon** means the monitor is disabled.
* The **Site Health** column shows **Good** (green) or **Should be improved** (orange) when Site Health monitoring is enabled.
* **Last 24h Status** shows hourly green/red/gray indicators and a summary such as **Up** percentage or **Pending**.
More information about Site Health and monitoring settings is available [in this document](/sites/management/manage-child-sites#site-health-monitoring).